Written by Jose Vicente
We continue reviewing the APIs of SEO tools, after seeing how to use the Sistrix API, it is the turn to test the use of the SEMRush API from Google Spreadsheet. As we mentioned in the previous article, the idea is to make use of these SEO tools from Google Spreadsheet, so that we can access both tools from an interface that we use regularly. Therefore it is not necessary to be a programmer or have advanced technical knowledge to take advantage of the SEMRush API, although if we have programming skills we can incorporate them into the backend of our website.
As we have already discussed the benefits of automating this type of dashboard, let’s see how to incorporate SEMRush data into our example dashboard.
Access to SEMRush API
To access the SEMRush API we need to obtain our API key from the page http://es.semrush.com/es/api-use/. This is a 32-character alphanumeric code that must be included in all API requests. To know the tool’s unit consumption, log and other data, we only need to access our profile. From the SEMRush API we will be able to access data related to domains, keywords or what they call analytics API; but also data related to our projects and SEMRush account.
The SEMRush API returns data in CSV format, unlike Sistrix, which can return data in XML or JSON format.
In the case of SEMRush the API returns an html response with columns separated by semicolons, as if it were a CSV, so to access this data we will make an HTTP request, for example http://api.semrush.com/?type=domain_rank&key=API_KEY&export_columns=Dn,Rk,Or,Ot,Oc,Ad,At,Ac&domain=seobook.com&database=us
In this case we have made a data query related to a domain to the SEMRush API with the following parameters:
- type: the type of query we want to make, about the domain, keywords, backlinks, etc.
- key: our API key.
- export_columns: the columns we want to get in the API query.
- domain: name of the domain from which we want to obtain the information.
- database: the database of the country from which we want to obtain the data.
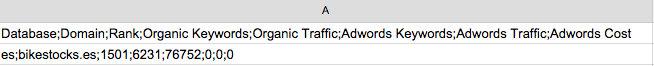
Which will return the following response:
Domain;Rank;Organic Keywords;Organic Traffic;Organic Cost;Adwords Keywords;Adwords Traffic;Adwords Cost seobook.com;24041;5249;37332;143496;0;0;0;0;0
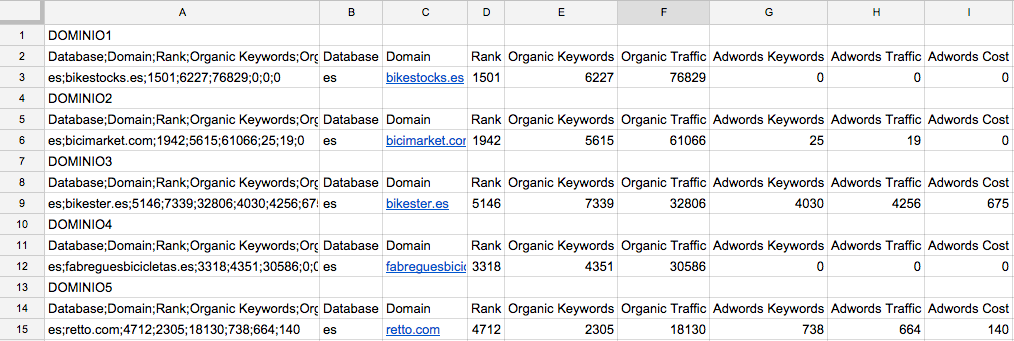
As you can see in the answer, it always starts with a row with the name of the columns and under it at least one row with the data requested from the SEMRush API. If we import to Google Spreadsheet the answer using the IMPORTDATA function, in the spreadsheet we will have each line in a cell. We do not get each data in a cell because Google Spreadsheet handles CSVs with commas as delimiters and the response is received with semicolons.
To solve this we only have to apply the SPLIT function, this function separates in columns a text by the delimiter that we indicate. For example, to transform A1 into columns by the semicolon delimiter we will use the function SPLIT(A1,“;”) with which we would obtain the following result in Google Spreadsheet.

This way we already have each data in a cell of our spreadsheet and we can reference them from our dashboard. We could get each data in one cell, but by doing it as a whole we can save requests and therefore units used from our API, since SEMRush consumes units of our account credit based on the number of rows downloaded, not columns.
Completing our scorecard
As we discussed in the previous article on the Sistrix API, setting up a dashboard makes more sense when we can get data from various tools. This will save us from having to access each of the tools to compare data from several domains. Therefore we add the data concerning organic positioning and AdWords as we have just seen.
We add the SEMRush API key to the configuration tab and in another tab we get the SEMRush API data for each domain to reference and format it from the dashboard.
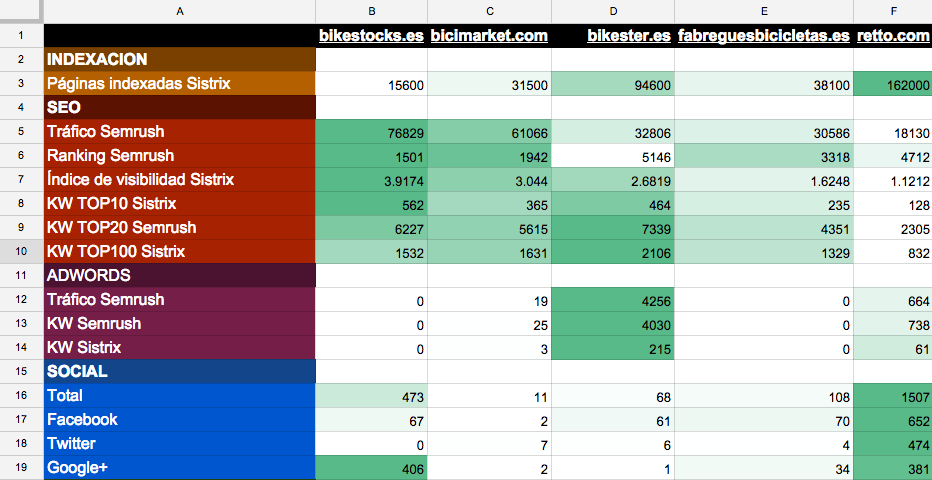
If we make use of the conditional formats of the Drive spreadsheets, we do not need to have graphs to be able to analyze the data at a glance. If we review the data from the above snapshot of the 5 randomly chosen domains we can draw the following conclusions:
- Despite having a lower number of indexed pages, bikestocks.es seems to be the domain with the best SEO visibility, it could be the best optimized of the 5. On the opposite side is retto.com, which with a higher number of pages has worse visibility indicators.
- The domain bikester.es could be the one that is investing the most in AdWords.
- The retto.com domain is the one with the best indicators in social networks, it is possible that it is maintaining more of its profiles than the rest of the competitors.
To this example that you can download from this link, you can add other indicators offered by Sistrix, SEMRush or any other tool with API. Remember that for the dashboard to work we must configure the Sistrix and SEMRush API keys in the Settings tab. This type of table is useful when monitoring our site against our competitors or to have some indicators to compare the data of a domain that has asked us for a quotation against its competitors.