Written by Ramón Saquete
The new top web metrics report from Google Search Console (also called Core Web Vitals metrics) provides us with very interesting aggregate data that lets us know whether the perception of web performance is good or bad for users. In addition, it also serves to detect the worst optimized parts of the web and thus be able to attack the points that have the greatest impact on performance. Let’s see what information this type of report presents and how to interpret it.
To access this report, go to the side menu and click on the option “Main web metrics” (formerly called “Speed (experimental)”) in the “Improvements” section:
Here we will see a screen similar to the following one:
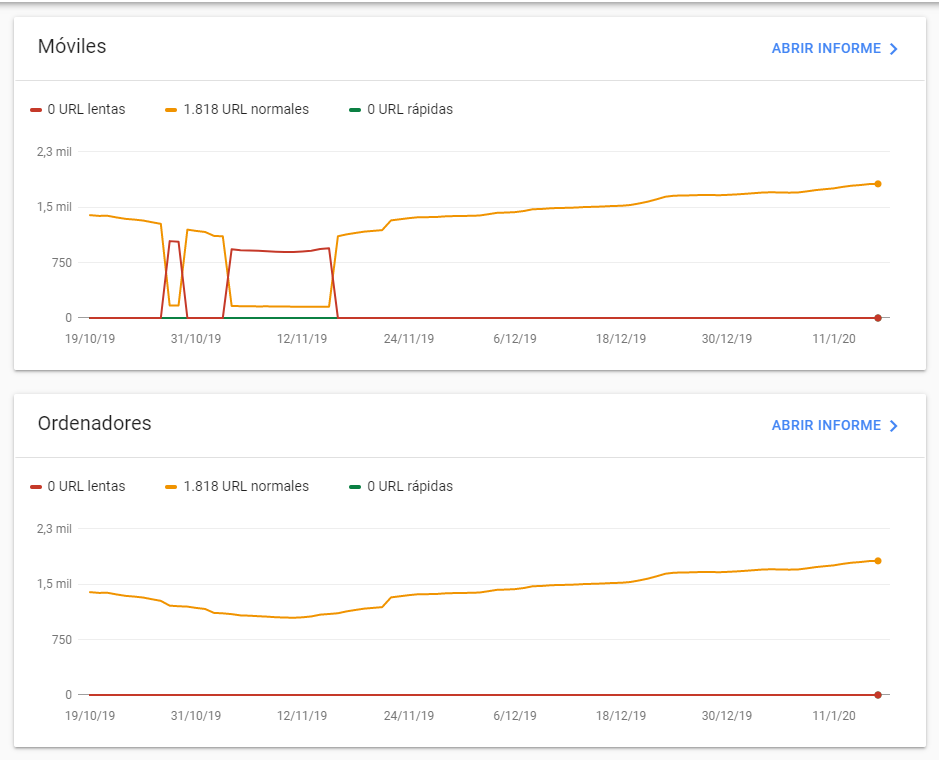
On the X-axis of the graph we have the number of URLs that are slow, normal or fast and on the Y-axis the date. In this way, we can observe how the performance of URLs evolves. Normally, when there is a change (e.g. from normal to slow URLs), the total number of URLs analyzed remains more or less stable, as in the mobile section of the example above.
Where do you get the data you show?
Google Search Console needs to obtain the FCP and FID performance metrics to know if a URL is normal, fast or slow. These are collected by Google Chrome from users and stored in a public database named Chrome User Experience Report. To launch queries to this database it is necessary to know how to program multidimensional queries, so it is easier to consult the historical data of our domain in this new screen of Google Search Console or to obtain this same performance data directly from Google PageSpeed Insights:
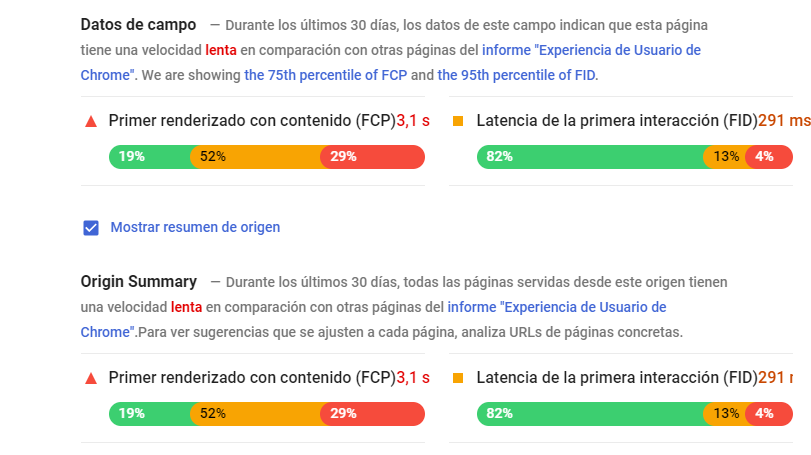
In Google PageSpeed Insights we can see the aggregated values obtained from users in the last month for the FCP (First Contentfull Paint) and FID (First Input Delay) metrics , both on the analyzed page (field data section) and for the entire domain (source summary). These metrics have the following meaning:
- FCP: the time it takes for the first DOM element to be painted on the screen. Google does not take as a value the mean, but the 75% percentile.
- FID: is the delay in the response of the page when the user interacts with it for the first time (for example, by clicking on a link). Here Google takes the 95% percentile as the value.
Update: PageSpeed Insights now also shows the following metrics collected from users:
- LCP (Largest Contentful Paint): time to paint the largest visible image, video or text on page load.
- CLS (Cumulative Layout Shift): sum of the scores assigned to each element that changes size or position within the visible area when the page loads. These scores are calculated as the percentage of the visible screen occupied by the element that has changed, multiplied by the percentage of the distance that has been moved.
Since they are metrics collected from users, they do not depend on the state of the server and the network at the time of testing, so, unlike the other metrics of this tool, we will always get the same values if we perform several tests in a row.
What we have in Google Search Console is a history of the same metrics with the number of pages containing a fast FCP, a normal FCP and a slow FCP (and likewise for the FID). As we will see below, you can also see timing data for each of these metrics at the page level, but not at the domain level as shown by Google PageSpeed Insights.
When does Google consider each metric to be fast, normal or slow?
Google establishes from what time a metric is considered good or bad based on the overall performance of all domains visited from Google Chrome, from which it establishes the rankings. They are currently established as follows:
- FCP: less than 1 second is fast, between 1 second and 3 seconds is normal and more than 3 seconds is slow.
- FID: less than 100 milliseconds is fast, between 100 milliseconds and 300 milliseconds is normal and more than 300 milliseconds is slow.
- LCP: less than 2.5 seconds is fast, between 2.5 seconds and 4 seconds is normal and more than 4 seconds is slow.
- CLS: less than 0.1 points is good, between 0.1 and 0.25 points is normal and more than 0.25 is poor.
When one of the two metrics is slow, consider the URL to be slow even if the other metric is fast. In the Google Search Console report, we can break down the performance of each metric separately and access a list of URLs that fall into each category:
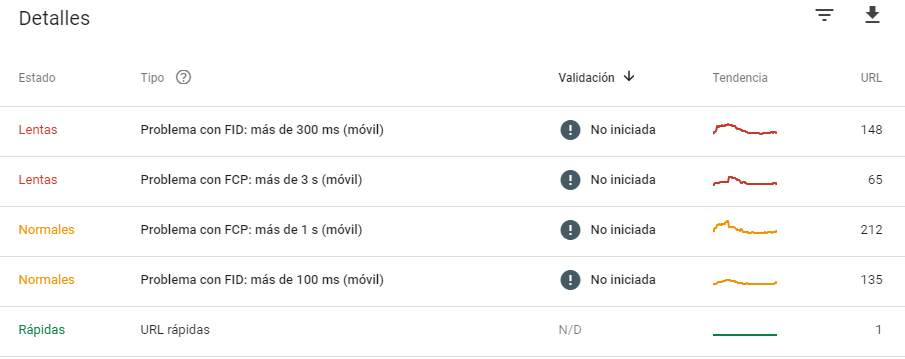
By clicking on one of the sections of the previous list we can see the list of URLs with their times and order them from the slowest to the least slow.
Keep in mind that Google Search Console only shows data from those pages for which it has obtained a statistically significant sample and thus prevents outliers from clouding the result. Therefore, it is normal that only a few URLs of our site appear.
What practical use is it?
In these lists of slow URLs for FID, FCP, LCP and CLS metrics that we will have arrived at in the previous point, we can identify if the URLs belong to a particular template or type of URL of our site that is poorly optimized and try to address the problems in this part of the code. In this way, the overall rating would go up and, consequently, the positioning would improve.
It is also a good tool to monitor how the performance of our site is evolving and evaluate whether updates in programming, changes in configuration or server hardware have a significant impact on performance and on which metric, either positive or negative. However, if this impact is not significant, it will probably not be detected in this type of report.
In conclusion, we can better track performance and attack those parts that require further improvement.