YouTube Analytics

Anastasia Kurmakaeva

Written by Anastasia Kurmakaeva

YouTube Analytics is a system for monitoring user activity around your videos and YouTube channel. It is the heir to the old YouTube Insights, and since its launch in November 2011 its interface has undergone different variations until reaching the current one, integrated within YouTube’s main Control Panel, known as Creator Studio which is essential for any video marketing strategy.

Youtube Analytics Dashboard

Types of YouTube Analytics reports

Overview / real time

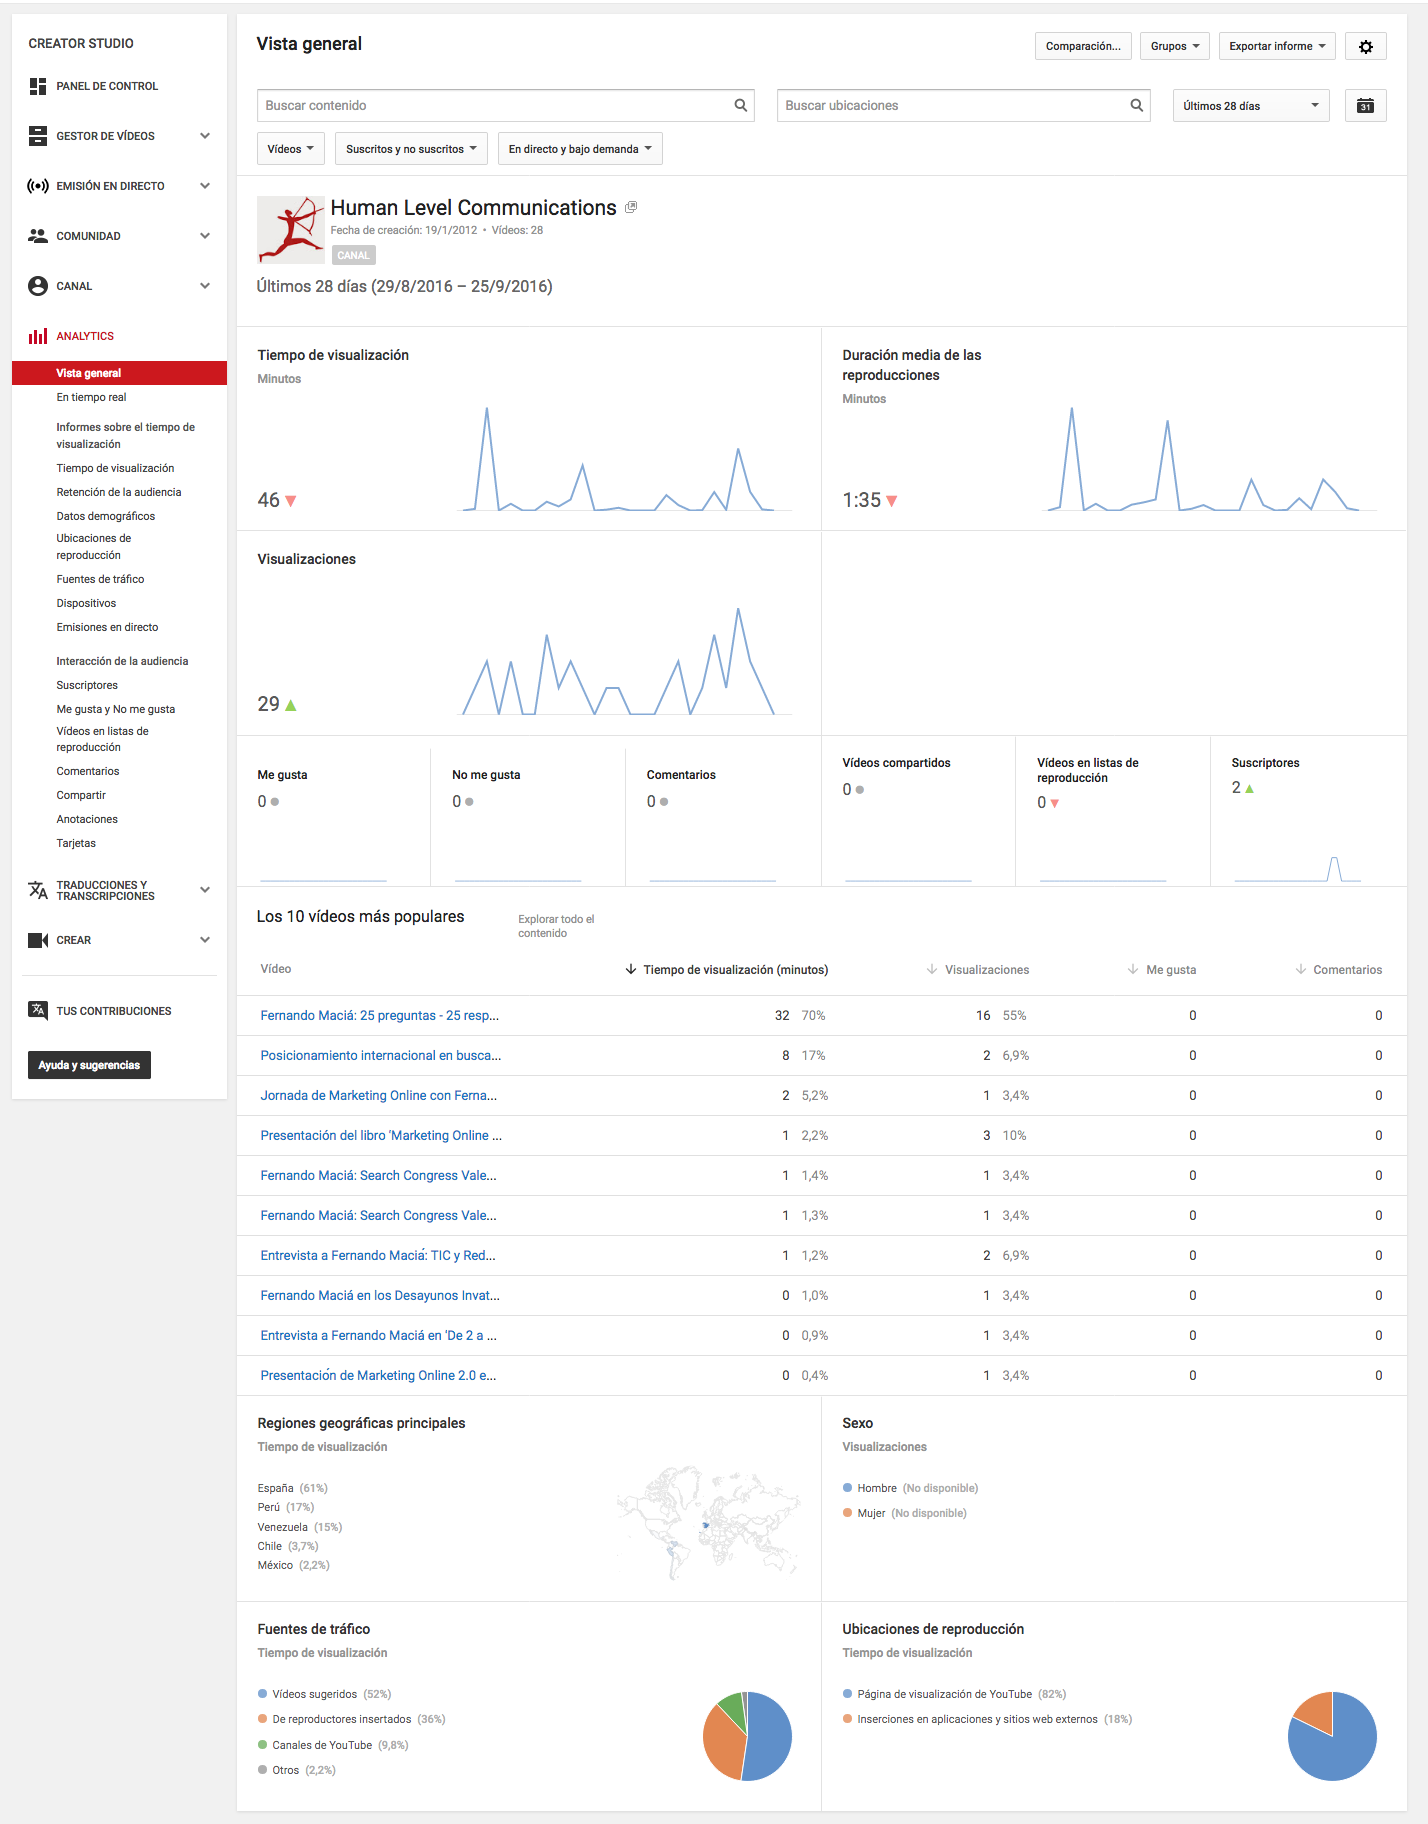
Once inside YouTube Analytics, we will find the Reports Menu on the left side of the screen and the Overview in the central part. By default, this second area will show a report with the most relevant activity recorded by our videos during the last 28 days, through different graphs and tables. However, it is possible to customize this report from the options located at the top of the screen, which allow us to perform the following operations:

Youtube Analytics top navigation box

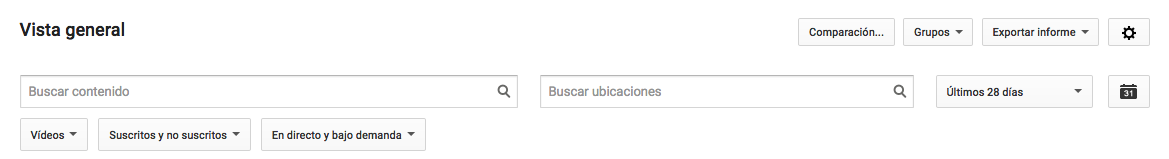
  • Search for content: it segments the results showing only the activity related to one of the videos we have hosted in our channel.
  • Search locations: segment data by country or region (continent) of origin.
  • Determine the time period to be analyzed: either through the drop-down tab or using the calendar.
  • Show video statistics: of our videos or playlists.
  • Show user statistics: whether they are subscribed users to our channel, non-subscribed users or all users.
  • Comparisons: compare the evolution of 2 contents hosted on our channel.
  • Creation and management of “Groups”: to measure the joint evolution of a given group of content, whether videos or playlists.
  • Export data: to a .csv or .xls file.
  • Indicator configuration: the units of Currency, Time and Frequency shown in the graphs.

In this way, by activating different options and filters, we can go from global information to a much more specific report. For example, if we wanted to know the evolution in our main market of our most recent video, we would simply choose the content and country in the search panel and select “This week” in the drop-down panel.

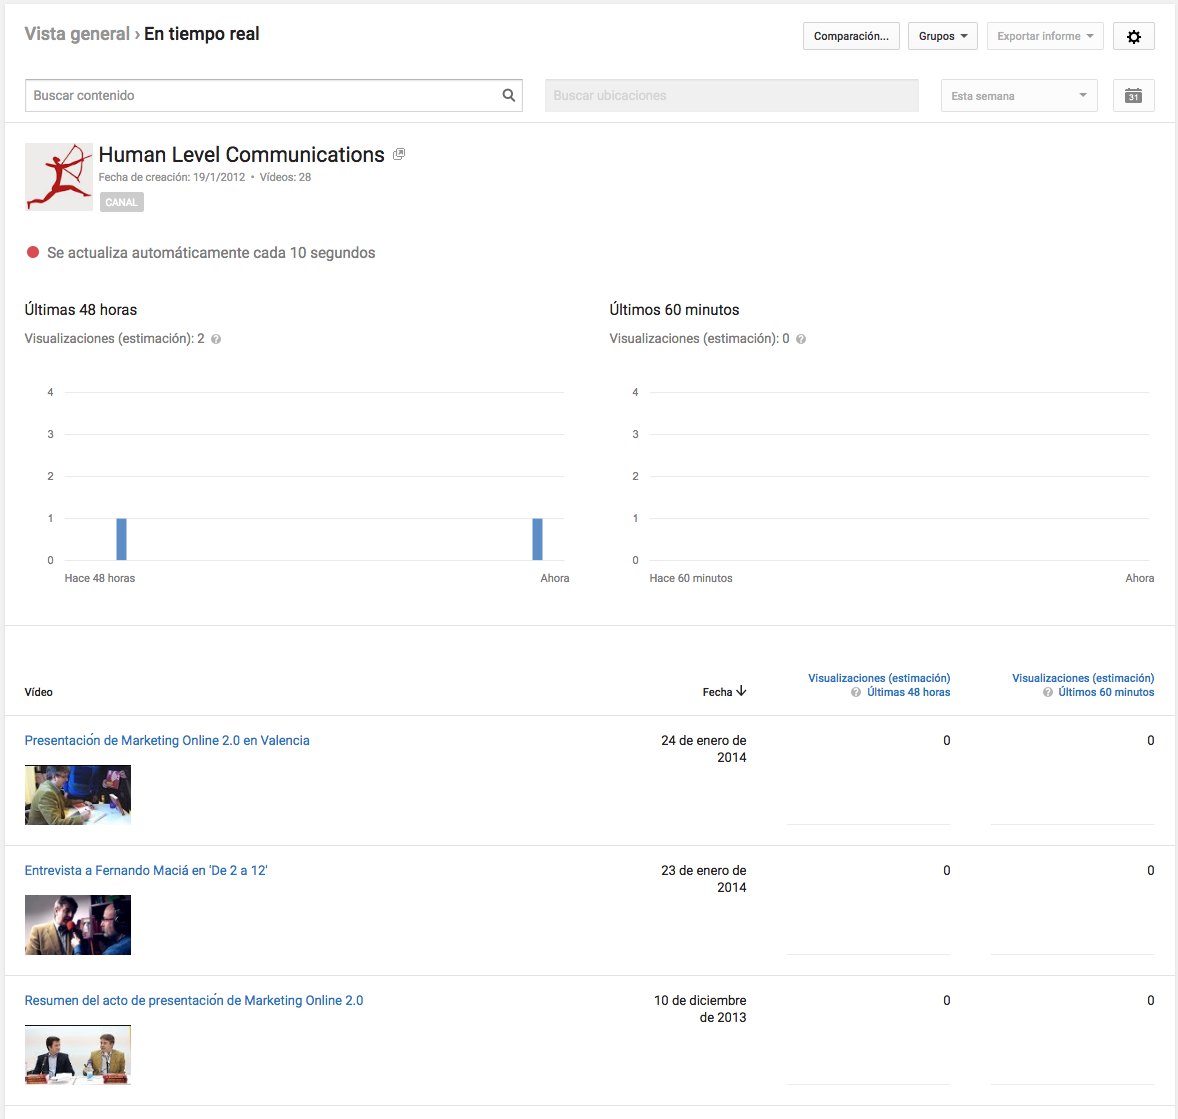
Another way to obtain this data is to consult the “In real time” report, which is very useful to know the most immediate activity related to our contents. You will find it in the main menu, next to the “Overview” report.

Youtube Analytics

Specialized reports

In these reports we will go deeper into the information of the different aspects covered in Overview. All of them are accessible from the main menu, where we will find the following classification according to the nature of the metrics they offer:

Revenue reports

  • Revenue: shows an overview of the volume of revenue you are earning from advertising activity, as well as the different sources (revenue streams) from which this revenue comes. This report will only be available to users who are part of the YouTube Partner Program with an associated Google Adsense account.
  • Ad rates: allows you to make a comparative analysis of the performance of the different types of ads displayed on your channel. In other words, it allows you to see a breakdown of how many ads have been aired with your videos and how much money each ad has generated by ad type.

Display time reports

  • Viewing time: here you will find two of the most important metrics to consider, the number of views (reproductions) and the viewing time (duration of reproductions). By comparing both indicators, you will get a quantitative view of the views received, knowing which video has aroused more interest and which ones generate more abandonment despite having a high volume of views.
  • Audience retention: from this report you will get a more qualitative view by analyzing the performance of your videos. Either by observing the general evolution, or by selecting a specific content in the search panel, the graphs will show a temporal evolution of the average duration of the reproductions. In other words, thanks to this report we will be able to know when our content is most followed and when users abandon us.
  • Demographics: include demographic information (gender, age) about your audience. Thanks to this report you will be able to determine whether your content is being followed by your target audience or not.
  • Playback locations: this report shows a list of the locations from which your videos have been played, whether it is the YouTube or your channel page, external applications or inserts on other websites.
  • Traffic sources: this report complements the previous one, since breaks down YouTube’s functions (search, suggested videos, etc.) and external sites from which users have accessed the content. This way, we will know if our videos are more viewed from social networks, our website or from our website.
  • Devices: shows information about the different devices and operating systems from which our contents are being consulted, a very useful information when designing our content strategy and adapting it to the different formats.

Audience interaction (or participation) reports

  • Subscribers: this report details how many subscribers you have gained or lost for each video, location and date. If your content strategy is to create a community of users on YouTube, this report is essential, because thanks to it you will know what kind of content has helped you to attract more users.
  • Likes and Dislikes: in the graphs of this report you will be able to observe the evolution of the “Likes / Dislikes” received by your videos, as well as a breakdown by location, date and subscription status. It complements the more qualitative reports in the previous section.
  • Videos in playlists: in this report you will be able to know how many of your videos have been added by users to their playlists or to the “watch later” option. These are very useful indicators when determining the popularity achieved by your content.
  • Comments: another of the most useful reports if your content strategy is focused on the YouTube user community. In it, you can obtain alist of all the comments that each of your videos have received, as well as the country of origin and the date.
  • Sharing: this report shows the number of times your videos / playlists have been shared, as well as how they have been shared among the different options allowed by the platform (copy link to clipboard, share buttons on social media, embed on web pages, etc.). Together with the number of reproductions, it is the most important indicator of popularity.
  • Annotations: in this report you can check user activity around annotations (call boxes and other messages) inserted in your videos, such as the number of impressions, clicks received and closing rate.
  • Cards: measure the interactions received on the cards you have published with your videos. A report with similar characteristics to the previous one, although the information it offers is greater given the wide variety of card options offered by the tool.

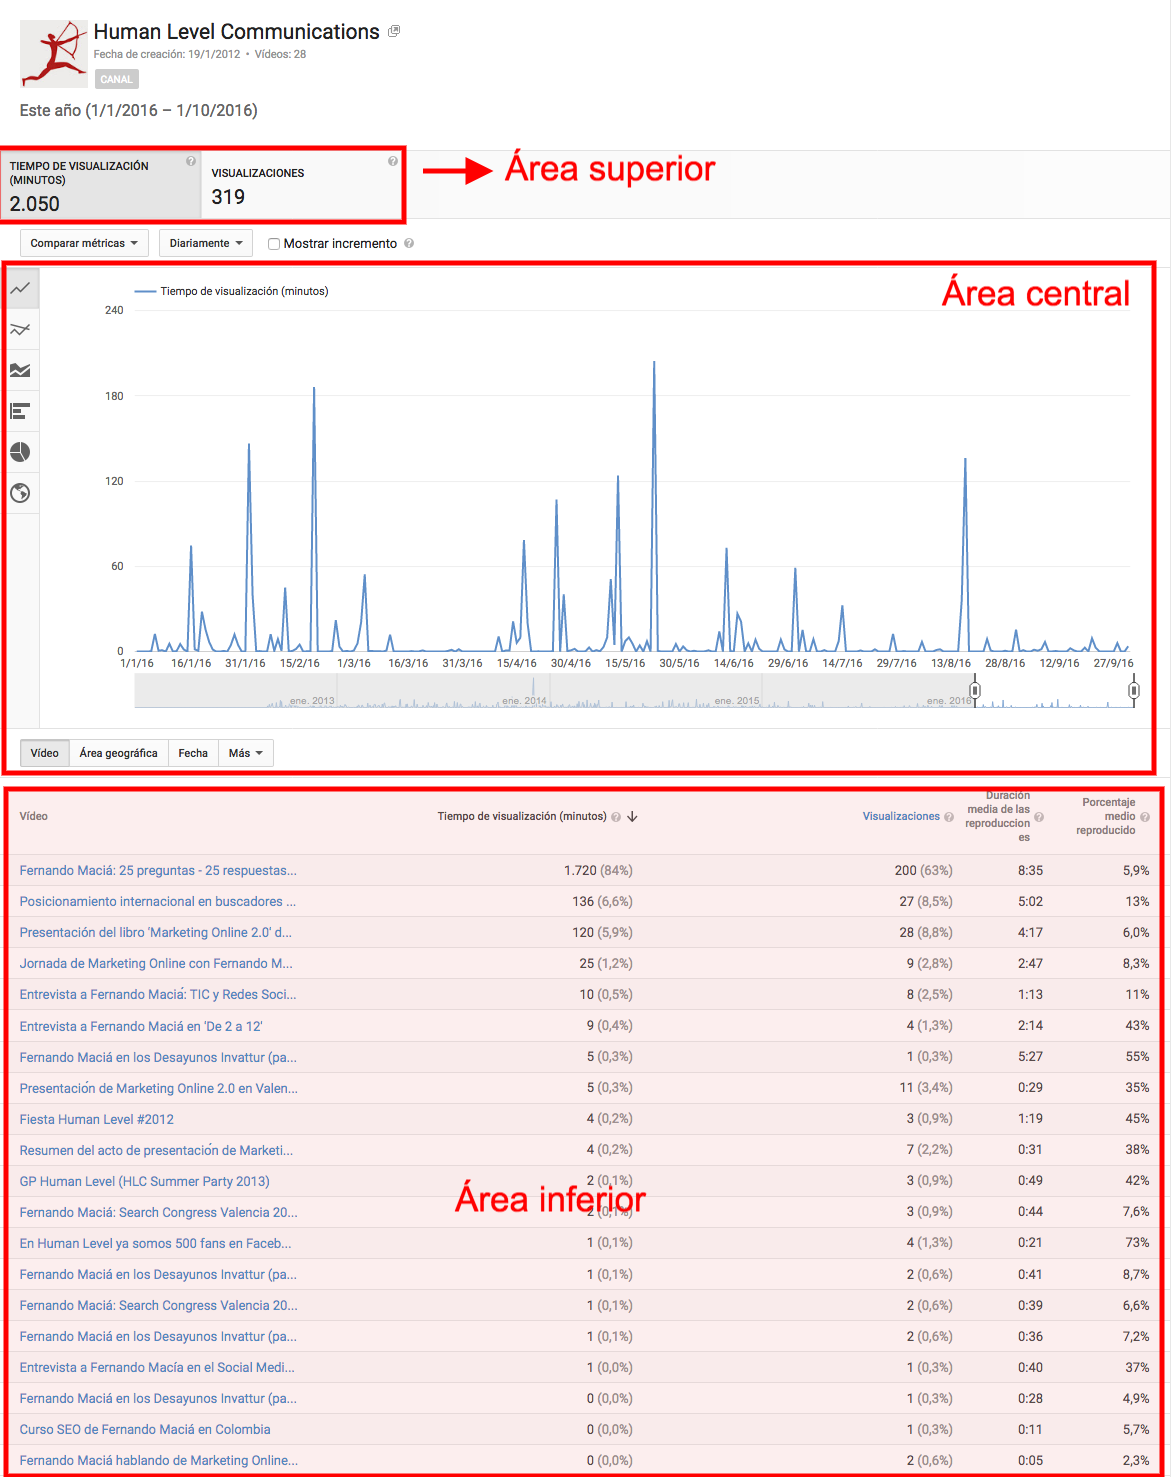
Although the data and graphs vary depending on the report, they all have a common structure:

  • Upper area: with the most relevant indicators of the selected report.
  • Central area: shows the temporal and geographic evolution of the above-mentioned indicators through different types of graphs (linear, bar, stacked area, pie or map), allowing to cross-reference these data with different dimensions, such as Date, Geographic area or Subscription status.
  • Lower area: shows a table with a list of data belonging to the dimension we have selected in the previous graph.

Structure of a report in Youtube Analytics

  •  | 
  • Last modified on
Anastasia Kurmakaeva
Former SEO consultant and translator at Human Level. She is a specialist in translation and SEO, with a special focus on the Yandex search engine. She is fluent in Russian, Spanish and English, being fully bilingual in the first two.
en