

Written by Fani Sánchez
Index
There are a multitude of tools that can help us analyze user behavior on our website. They can collect data, movements or recordings that provide us with valuable information about what is working or not working. However, we must bear in mind that the larger the sample, the more reliable the data collected will be. We cannot make conclusive judgments based on a few behaviors, unless the shortcomings are obvious (these cases usually occur on websites with considerable room for improvement).
The larger the sample size, the more reliable the data collected in Hotjar will be.
In this post we are going to talk about one of these tools that will help you in user behavioral analysis: it is called Hotjar and its free version, although it has logical limitations, is more than enough to investigate websites with average traffic levels or sites with room for improvement.
Installing Hotjar on our site
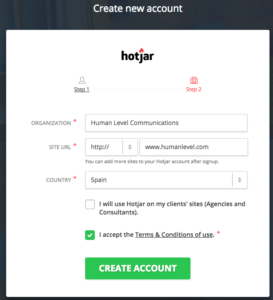 Installing Hotjar on your site is as easy as creating an account and specifying a website. After completing the registration, the initial screen of the tool will serve us the script (the tracking code) that we will have to paste in the header (<head>) of our site. You may need the help of a programmer for this.
If your website is WordPress, good news: you can include the code yourself in the header.php file from the template editor (Appearance menu > Editor). Or even easier, you can download their plugin and install it.
Once you have inserted the code, you will only have to verify from Hotjar that you have done it correctly and you will be able to start using the tool.
Hotjar features
Hotjar has up to 7 different types of functionalities that we can use on our site depending on the objectives we set: heat maps, recordings, conversion funnels, forms, surveys and recruiting. Hotjar configuration is done at the level of each of the functionalities. Below we will detail the operation of some of the most interesting ones and what conclusions can be drawn from their application.
Heat maps
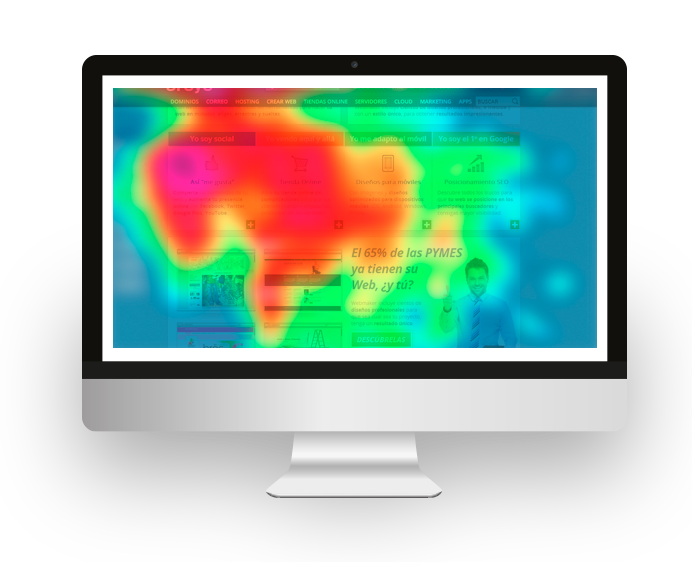
By tracking the cursor on the screen we will have important information about what the user is looking at.
Previously we have already talked in this blog about the advantages of heat maps as a method of behavioral analysis. These are based on tracking the movement of the mouse to know how the user moves around the page on the screen. Studies say that the mouse follows the gaze, so by tracking the cursor we will have important information about what the user is looking at.
This tool will analyze the cursor movements, clicks, and scroll that users make on a given page, so you can see a screenshot similar to this one:
How to analyze heat maps
To begin with, you will have to analyze separately the maps collected by each of the devices (desktop, mobile and tablet). In addition, you should keep in mind that on tablets and mobiles, we use the same gesture to scroll as to click on a link: tap or tap . If we do not take this into account, the data can easily mislead us. By the same token, this implies that the data in this regard are not entirely reliable.
However, taking the previous aspects into account, by analyzing the heat maps you will be able to know:
- What are the elements that most attract your audience. Why are they? Maybe they deserve another place on the page?
- Which menu item is most clicked. Should you consider reordering?
- Which elements are not being properly interpreted.
For example, with the click map you notice that one of the images in your slideshow is particularly clicked on, although it does not lead anywhere. This data reveals what users expect from interacting with it. Include a call to action on the image, a sales text and link to the related service in question.
Forms
 In this section of Hotjar you will be able to evaluate the effectiveness of the forms you have at page level. This means that if you have a form in the sidebar that is common to the whole site, forget about finding out where the results come from or which pages have the highest conversion rate (for that you will need the advanced analytics of other tools).
If you have an important form in a common part of the site or repeated on several pages, what you can do is to create the tracking for the two or three pages with the most visits where it appears. In this way we will be able to collect a larger amount of data in less time, so the sample will be more reliable.
I also recommend that you set up analytics for contact page forms, newsletter subscription, new user registration and ultimately, prioritizing among those forms that bring you the most valuable leads.
How to analyze forms
The results of the forms can give you a lot of information about what you are doing wrong when it comes to collecting data about your users. To do this, you should analyze in which step the visitors “get stuck” (since you can analyze the time they spend in each field), which ones they complete, in which fields they abandon… You may realize that you are simply forcing them to leave too much data or that it is one of the fields in particular that is pulling your visitors back.
Recordings of visits
One of the features you will appreciate the most in Hotjar will be the random recordings of visits in real time. With them, you will be able to see the complete behavior of a visitor from the moment they enter to the moment they leave your site, whether they are browsing one page or fifty. A line helps to track your itinerary, and a circle marks where you have clicked. Can you imagine all the information it can give you? These are just some of the questions you should ask yourself as you watch your recordings.
How to analyze visitor recordings
Some of the questions we can ask ourselves to try to understand the objective of our users are the following:
 Do they try to click where there are no links? Maybe it’s an opportunity to insert the link they are waiting for or maybe you should remove ambiguities that lead to confusion, so they can focus on what you are really interested in.
- Do they come back again and again to the same place? They may not quite understand what you want to convey or something may catch their attention but they don’t take “the next step” because you haven’t made it easy for them.
- How fast do they get in and out of the pages? Maybe they are not interested in its content, or they have arrived there by inertia if the link was too much
- How many pages do they view and in how much time? Can they not find what they are looking for? Consider whether the information is well distributed on your website.
 Do they try to click where there are no links? Maybe it’s an opportunity to insert the link they are waiting for or maybe you should remove ambiguities that lead to confusion, so they can focus on what you are really interested in.
Application
The functionalities we have seen can be applied to a single page or to a pattern of pages, simply by selecting “Exact match” (for specific pages) or “Starts with” (for a template of pages that follow the same pattern in URL syntax) from the configuration drop-down menu.
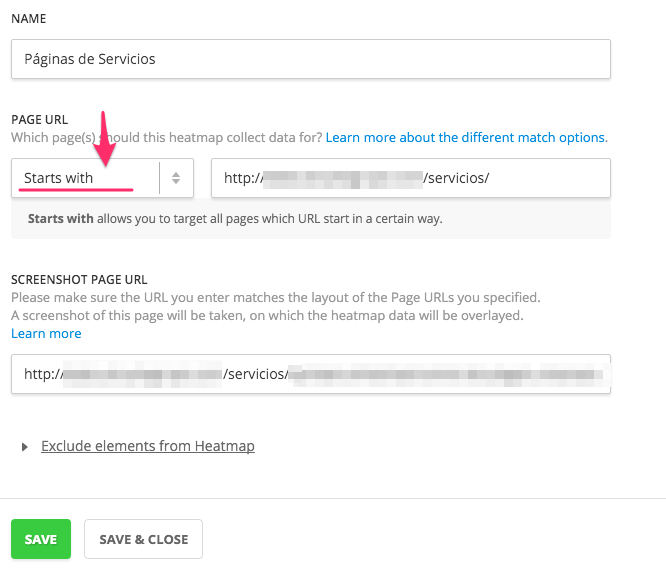
If we choose the second case, it is very important that the pages to be analyzed have practically the same structure, so that the test results are consistent. These cases would be used to study page templates, such as product sheets. For example, in my online shoe store all product URLs have the image carousel, text, comment boxes and social buttons in exactly the same place. They occupy practically the same space in all of them and follow the same order. In these cases, we could stipulate the“Starts with” filter for product card URLs, which all start with http://www.midominio.com/producto/. The tool would then analyze the behavior of visits to any product page that matches this pattern.
For the free version, the analysis is limited to three URLs or page templates. We recommend analyzing the home page(exact match), the service or product URLs as long as they have the same structure(starts with) and a conversion page(landing page interesting for our objectives, contact form…). If you have to choose an exact match for the product or service pages, analyze the one with the most SEO visits according to Analytics (if this is the segment you are interested in) as you will receive the data earlier and it will be more reliable due to a larger sampling.
Other functionalities
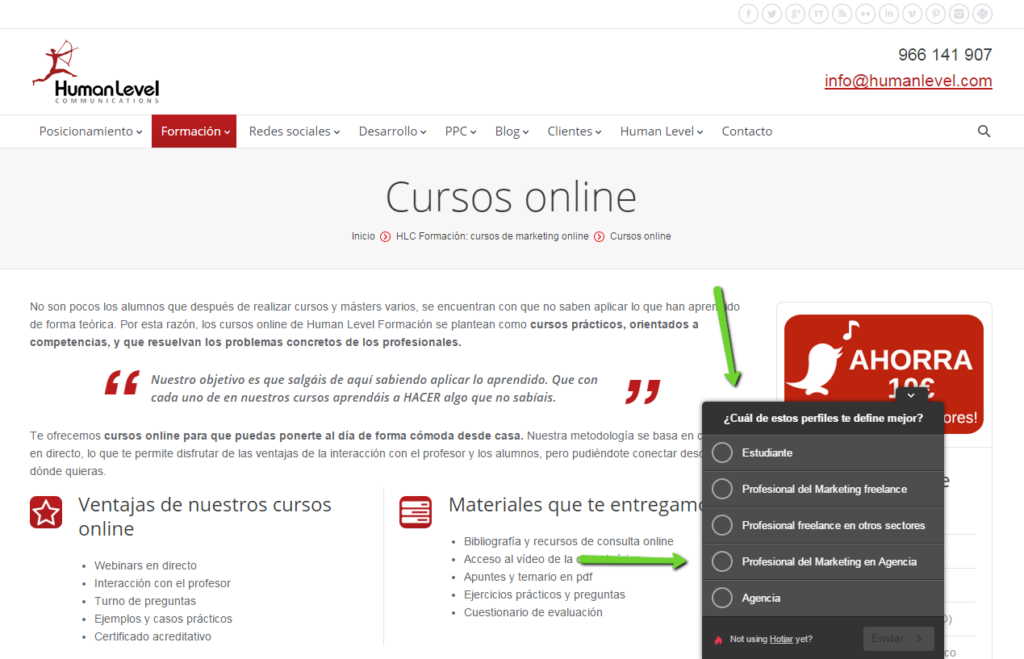
On the other hand, Hotjar has other functionalities more related to obtaining feedback, such as surveys and questionnaires, which are equally interesting. It’s nothing we haven’t seen in other applications, but the truth is that it is an advantage to have it all integrated in the same tool. A poll is a mini-questionnaire that will appear as a pop up in the part of the page you have chosen. It is used for a brief survey on very specific topics, although you can include as many questions as you need.
On the other hand, a questionnaire or survey is developed on a page created for this purpose, with all the questions developed in them.
As you can see, some of Hotjar’s functionalities can be achieved by implementing advanced analytics on the website: scheduling events with Analytics, tagging content with Tag Manager… However, Hotjar is a convenient and affordable option for those who do not have large resources at their disposal, be it capital, technical expertise or time.